The food and drink industry is the UK’s largest manufacturing sector, and forms part of a diverse and complex supply chain.
We publish regular reporting on our industy's performance, including our 'Our Industry at a Glance' publication which outlines key industry data.
We work with a wide range of organisations to address data gaps and collect industry data. We remain committed to widening our reporting and providing a robust evidence base to support policy development.
 Food and drink manufacturing contributes more to the economy than all other manufacturing sectors, including automotive and aerospace.
 Food and drink manufacturers directly employ over 456,000 people across every region and nation of the UK, an increase of 0.1% from 2021.
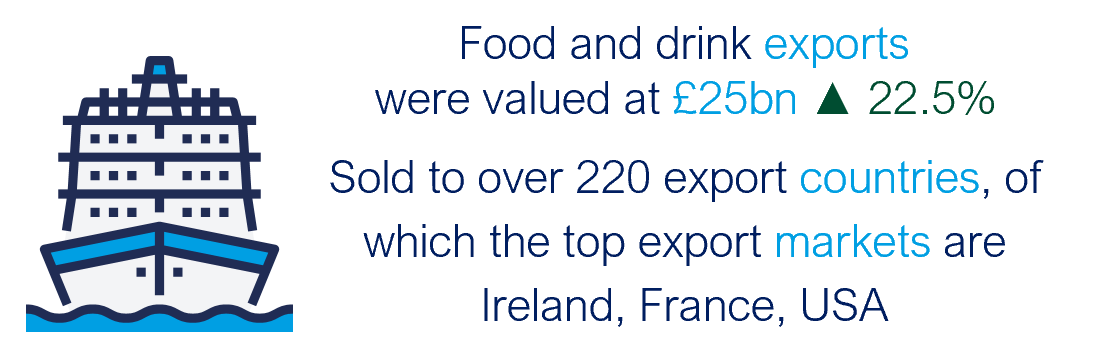 Exports of food and drink made an important contribution to the economy, approaching £25bn and going to over 220 countries and territories worldwide. Our top 3 exports partners are Ireland, France and the USA.
 The UK’s 12,460 food and drink manufacturing businesses are committed to investing, with total business investment in the industry equalling £3.1bn, down by 22.7% from 2021, following tough business conditions.
Updates & milestones
Our Industry at a Glance 2021
The FDF 2021 Our Industry at a Glance factsheet highlights the significance and importance of food and drink manufacturing to the UK economy.
Figures show that the food and drink manufacturing contributed £30bn to the UK economy, growing by 4.2% on the previous year. The industry has a turnover of more than £112bn, accounting for 20% of total UK manufacturing as the biggest manufacturing sector in the country.
The importance of the industry goes beyond turnover. Food and drink manufactruing employs 468,000 people across every region of the UK and is a key part of the food and drink supply chain, which employs 4.2m people and is worth £126bn to the economy.
Exports are a key contribution to overall industry growth, exceeding £20bn in 2021 and going to over 220 countries worldwide, with Ireland, France and the USA as the top three destination markets.
Industry at a glance 2020
UpdateIn our new Industry at a Glance report, FDF highlights the significance and importance of food and drink manufacturing to the UK economy.
Figures show that the food and drink manufacturing contributed £28bn to the UK economy, growing by 2.3% on the previous year. The industry has a turnover of more than £105bn, accounting for 20% of total UK manufacturing as the biggest manufacturing sector in the country.
The importance of the industry goes beyond turnover. Food and drink manufacturing employs 430,000 people across every region of the UK and is a key part of the food and drink supply chain, which employs 4.3m people and is worth more than £120bn to the economy.
Exports are a key contribution to overall industry growth, exceeding £23bn in 2019 and going to over 220 countries worldwide, with Ireland, the US and France as the top three destination markets.
Related
Industry at a glance: Diet and health
Compared to 8 years ago, the average shopping basket of FDF member products is lower in calories, sugars and salt.
Economic insights
We publish timely analysis of developments within the wider economy and the food and drink industry, providing context about the economic events that shape our industry and views on potential future implications.

FDF Trade Snapshots
Our quarterly Trade Snapshots provide analysis of the latest trends in UK food and drink exports and imports.